UP TO 824% INCREASED ROAS FOR A WOMEN’S LINGERIE BRAND IN THE U.S.—GOOGLE ADS CASE STUDY
-
Post author

-
At the start, Google Ads was generating around 2 sales per month with a ROAS of 14.4%. After 3 months, this channel became the main source of sales with a ROAS of 824%.
We discovered that the issue was not only in the ad settings. The results were also affected by the website, product feed, campaign structure, and traffic quality.
In this case study, we’ll show how step-by-step work with analytics, the website, and campaigns helped bring advertising to a stable return on investment.
Google Ads
Service
Ecommerce, women’s underwear
Industry
USA
Target Region
Results
+513%
Traffic
824%
ROAS
+1300%
Transactions
Client
Our client is a U.S. women’s underwear brand made from bamboo viscose. The company manufactures its products in Washington State and focuses on comfort, material quality, and ethical production.
The brand does not operate in the mass market. Its audience looks for eco-friendly materials, pays attention to tactile comfort, and takes longer to make a purchase decision. This niche gives the brand a strong advantage over competitors, but at the same time narrows the audience and makes sales more challenging.

Before starting work on the account, only a Performance Max campaign was running. It generated around two sales per month with a ROAS of 14.4%.
The client’s main request—consistently generate sales from Google Ads and make this channel profitable.
Account Growth Strategy
We decided to turn off the old underperforming Performance Max campaign and build the proper system from scratch. At the beginning of our collaboration, we:
- set up analytics and verified data transmission to Google Ads;
- prepared Google Merchant Center and the product feed;
- analyzed the website from a conversion perspective;
- launched the first campaigns.
More details below.
Analytics
High-quality analytics became the foundation of all further work. Without it, Google Ads sees a distorted picture, trains algorithms incorrectly, and wastes budget on irrelevant traffic.
We checked the connection between Shopify, Google Analytics 4, Google Ads, and the website. As part of this stage, we:
- set up key e-commerce conversions;
- reviewed the GA4 configuration;
- tested the Shopify integration with Google Ads and GA4;
- verified that the system correctly tracks all events, purchases, and revenue.
We also took tracking discrepancies into account. Some conversions are not recorded due to iOS restrictions, ad blockers, and privacy policies. In this niche, the difference often reaches 20–30%, so we continuously compared Google Ads data with actual Shopify sales.
Primary Conversions
At the beginning, we trained the algorithms using two events:
- purchase;
- add to cart.
Purchases alone were not enough because the algorithm did not receive enough signals. The “add to cart” event accelerated learning and helped stabilize campaign performance faster.
Secondary Conversions
Additionally, we tracked:
- begin checkout;
- phone clicks;
- social media clicks.
These events did not affect optimization but helped us evaluate traffic quality and user behavior.
Google Merchant Center Review and Setup
Merchant Center determines how stable Performance Max and Standard Shopping campaigns will operate. That’s why we audited the Merchant Center account:
- verified the website;
- configured the sales country and shipping settings;
- checked compliance with Google requirements;
- tested the integration between Merchant Center, Shopify, and Google Ads;
- verified that the feed syncs without errors.
After this, the account had a technically clean foundation for launching advertising.
Website Usability
Advertising does not sell by itself. It only brings users to the website. After that, everything depends on usability and conversion rate. That’s why we analyzed the website structure, navigation, copy, CTAs, and loading speed. We reviewed the full customer journey from click to purchase for errors or friction points.
General Marketing Recommendations
We quickly identified several issues and provided the following recommendations:
- reduce the number of checkout fields;
- make buttons and calls to action more noticeable;
- simplify forms;
- improve mobile site speed;
- add photos with real-life models;
- highlight the product’s key advantage more clearly—bamboo fabric.
In this niche, users make decisions visually. If the product does not look appealing within the first few seconds, advertising loses money before the purchase even happens.
Mobile Website Issues
Most traffic came from mobile devices. That’s why we separately reviewed the mobile version of the website.
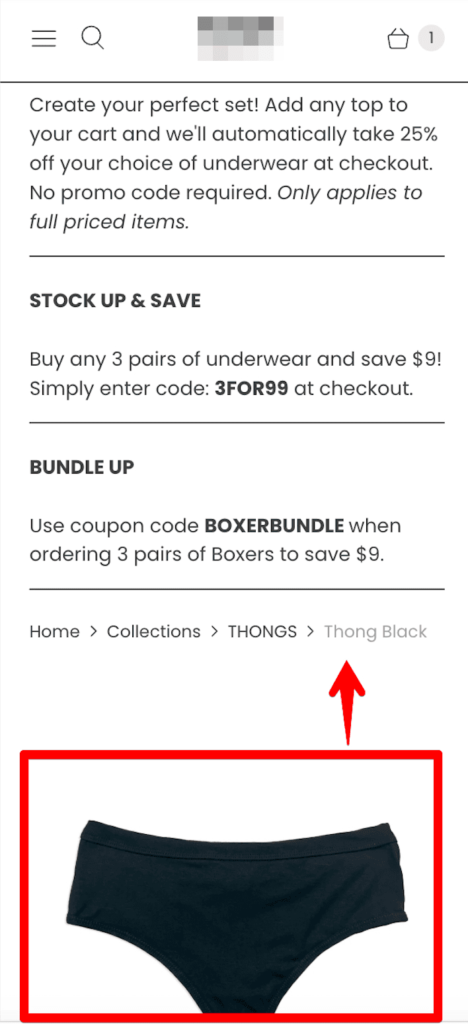
On the first screen, users saw secondary blocks and unnecessary text. Product photos and pricing only appeared after scrolling.
Because of this, people:
- didn’t understand what exactly the brand was selling;
- lost interest within the first few seconds;
- closed the page.
We suggested completely restructuring the product page. Photos, pricing, and the purchase button needed to appear immediately. We recommended moving all specifications and additional explanations lower on the page.
For this niche, it is critical, since the purchase decision is often made within the first few seconds.
The First Essential Campaigns
After preparing the website, analytics, and Merchant Center, we moved on to launching advertising campaigns.
Branded Search Campaign
First, we launched a branded campaign. It captured the hottest demand and prevented competitors from taking traffic from users who were already familiar with the brand.
Standard Shopping Campaign
At the same time, we launched a standard shopping campaign for the entire product catalog. This campaign provided the first useful data for further work with the product feed and search queries.
Thematic Search Campaigns
Next, we created three search campaigns focused on the main keyword clusters:
- bamboo underwear;
- antibacterial underwear;
- eco-friendly and comfortable women’s underwear.
Dynamic Remarketing
Separately, we launched dynamic remarketing. It brought back users who had already visited the website, viewed products, or added them to the cart.
Preparing for Performance Max
We intentionally postponed the launch of Performance Max. The account still did not have enough purchases, search queries, or behavioral signals for the algorithm to learn properly.

Expert Commentary
The specifics of e-commerce in the U.S. are such that in the B2C space, customer acquisition cost (CAC) often exceeds the value of the first order. This is especially noticeable in niches with relatively low-cost products—such as women’s lingerie.
In this project, our strategic advantage was direct collaboration with the manufacturer. The Direct-to-Consumer model provides much greater flexibility in margins and allows businesses to profit from LTV. However, a ROAS of 14.4%, which the account had before we took over, is essentially charity work for ad networks.
The main issue with the previous contractor was a classic vicious cycle. The account was running only a Performance Max campaign without a connected product feed, relying entirely on automated content. In practice, it functioned like a standard DSA campaign (dynamic search ads, which Google has already discontinued), bringing in low-intent traffic. Since the campaign was generating fewer than 30 purchases per month, Smart Bidding algorithms simply didn’t have enough data to learn from.
We broke this cycle—we restarted the learning process through classic Standard Shopping campaigns, added unique selling points through feed transformation rules, and preserved the well-designed product cards in Shopify. Instead, we technically enriched the feed itself with additional high-intent keywords, which improved search relevance and significantly lowered CPC. In addition, we conducted a UX audit of the store’s existing theme and helped the client’s developers successfully fix critical usability issues.
Marketing Link has completed more than 400 e-commerce projects. We know how to make advertising profitable for manufacturers and how to scale sales for distributors.
Ready to turn your D2C brand from a “black hole” for your budget into a predictable profit generator?
Request a free Google Ads audit today!
By the way, let’s look at the pure math. The average CPC in U.S. B2C e-commerce is around $1.5. If your website conversion rate stays at a basic 3% level (assuming there are no returns), the cost to acquire one customer is: $1.5 / 0.03 = $50.
Accordingly, if your business has at least a 40% margin, you break even at an average order value of $125 ($50 / 0.4). Anything above that is pure profit.
Of course, real businesses have additional operating expenses, and projects with an average order value of $60–$80 objectively face greater challenges scaling in the U.S. However, this case proved that through strict micro-segmentation, proper feed optimization, and daily traffic cleanup, it is possible to make advertising profitable and cover agency costs from the very first order. The high margins of a direct manufacturer became a powerful catalyst for success in this case.
Looking for a team that thinks in terms of unit economics, understands LTV, and is ready to scale your sales? Contact us—we’ll discuss the right strategy for your brand.
Account Optimization
Regular Account Optimization
After launching the basic campaigns, we moved to systematic ongoing optimization.
Budget Management
The project had a limited budget, so we did not work on all directions at once, but concentrated the budget where we saw real profitability. Higher budgets were allocated to campaigns with high ROAS. Campaigns that generated cheap traffic without sales were gradually limited or paused.
Bid Strategy Adjustments
We regularly reviewed bidding strategies. Some campaigns were running on tROAS, some on tCPA, and for certain campaigns we tested manual bidding.
Search Queries and Negative Keywords
We regularly reviewed actual search queries. Informational and irrelevant phrases were immediately added to negative keywords. This approach reduced wasted spend and left only audiences with higher purchase intent in the campaigns.
Geo, Device, and Audience Optimization
We analyzed which states, devices, and audiences generated the highest number of sales. After that, we increased bids specifically for those segments.
Ads and Google Recommendations
We regularly updated ad copy. We tested new messaging, changed focus points, and adjusted messaging for seasonal periods.
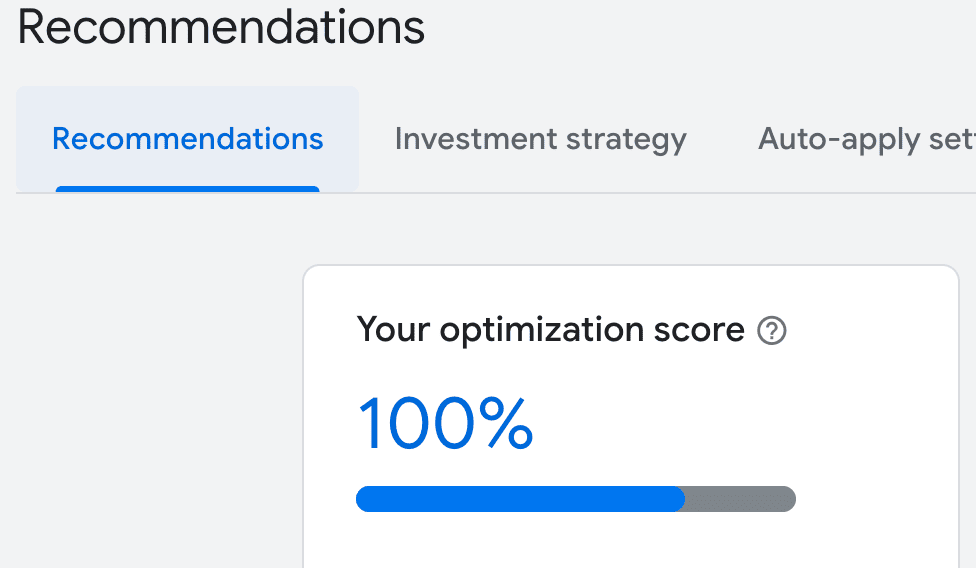
We only implemented Google Ads recommendations that provided real business value. Recommendations aimed at expanding reach were rejected. This allowed us to maintain the account optimization score at 100%.
Seasonal and Promotional Activities
We took seasonality and brand marketing activities into account throughout the process. We updated creatives, added promotional extensions with discounts, and strengthened remarketing for audiences that had already interacted with the brand.
Display Placement Quality Control
We regularly reviewed the websites where display ads were shown. Placements with low engagement, poor-quality traffic, or brand safety risks were immediately excluded.
Search Campaign Structure Optimization
Over time, we consolidated three search campaigns into a single STAG structure. Each ad group corresponded to a separate query cluster. We freed up part of the budget for more efficient standard shopping campaigns.
Performance Max Optimization
After collecting enough data, we tested a Performance Max campaign, but it did not meet expectations. A significant part of the budget was spent on YouTube and the Display Network, while sales performance remained weak.
As a result, we shifted the budget back to standard shopping campaigns, which delivered the highest return on ad spend.
📌 Read the guide: Launching Google Local Services Ads Campaigns
Feed Optimization
After stabilizing the account, we moved to feed optimization. The feed directly determines which search queries Google uses to display products.
Adding New Attributes
We enhanced the feed with missing attributes:
- gender;
- condition;
- material;
- color;
- product type.
We also expanded product descriptions by adding product names and specifications.
Improving Product Title Structure
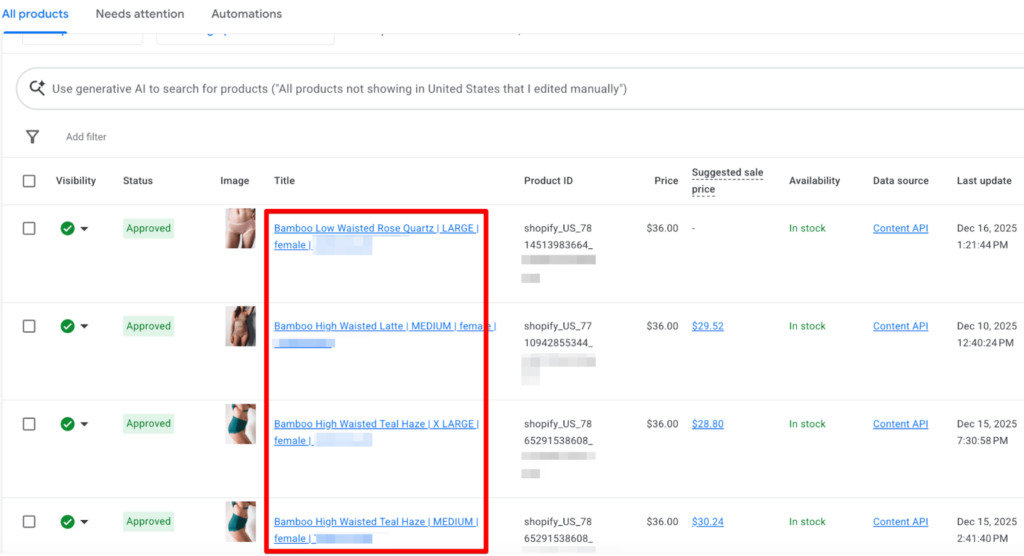
The biggest impact came from optimizing product titles. We added the word bamboo to the beginning of every product title through Merchant Center rules.
This immediately highlighted the product’s main advantage, kept it visible even in mobile search results, and reduced the number of irrelevant clicks.
Additionally, we created a unified title structure: material—product type—size—gender—brand.
Result
We improved traffic quality and increased the number of users who were specifically searching for bamboo underwear.
Difficulties We Faced
A Sharp Decline in Sales
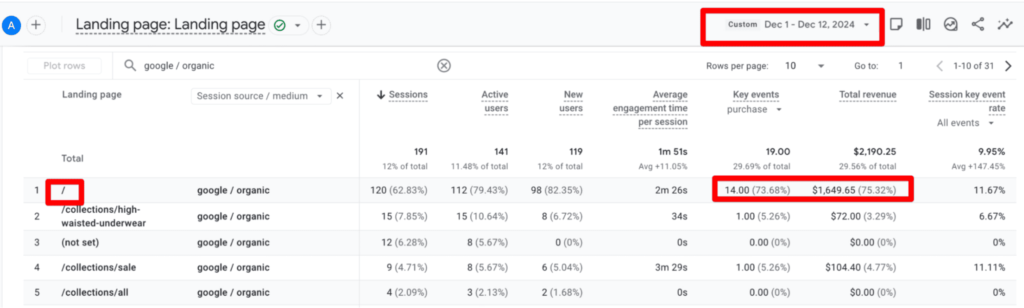
At the beginning of December 2025, the client contacted us due to an approximately 25% year-over-year drop in overall sales. We analyzed Shopify, GA4, and traffic sources and quickly identified the main issue. The decline was not caused by advertising, but by SEO.
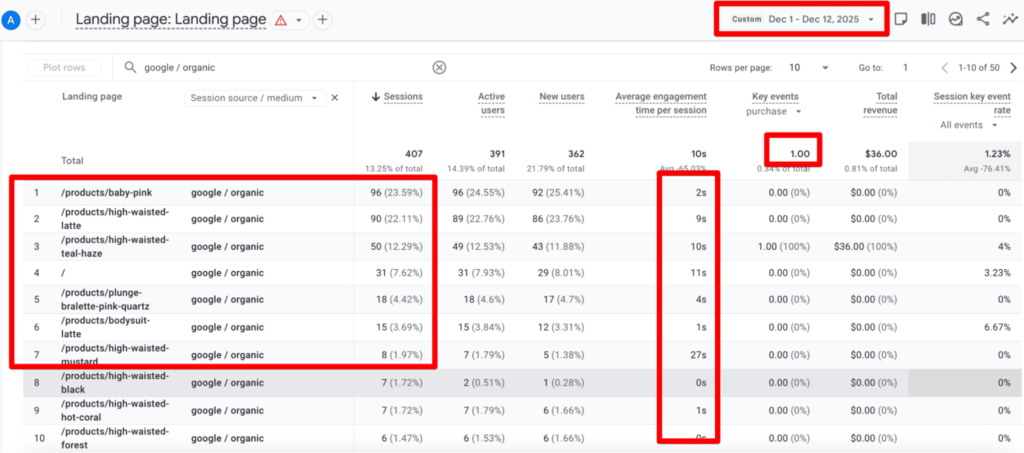
During the same period, the organic channel generated:
- 19 sales in the previous year;
- 1 sale in the current year.
We quickly identified the reason. Previously, most users landed on the main brand page, but later SEO started bringing people directly to product pages. This traffic turned out to be significantly colder and converted much worse.
Although SEO was outside our area of responsibility, we explained the reason for the decline to the client, conducted an SEO audit, and helped improve the site structure.
Recommendations for Recovering Sales
At the same time, we proposed a set of actions that could quickly compensate for the loss of organic sales:
- launch a moderate Christmas discount;
- highlight promotional offers on the website more aggressively;
- add additional value to orders;
- repeat the email campaigns that performed well during Black Friday.

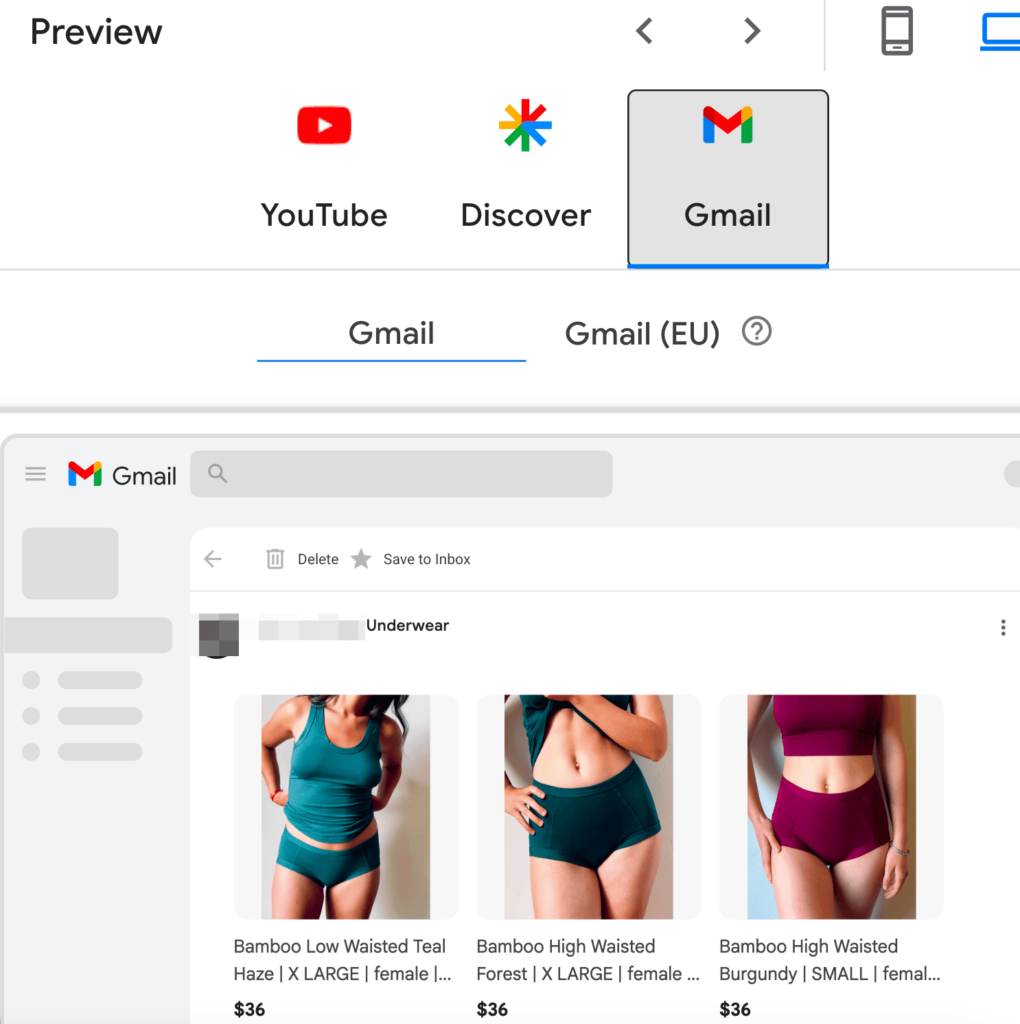
Expert Commentary
To strengthen the visual impact, another equally important focus in advertising was working with the remarketing audience. That is why, in addition to setting up a display campaign, we decided to launch Demand Gen with a product feed to increase the conversion rate. In this type of campaign, ads are shown not only on YouTube, but also in Gmail and the Discover feed.
Another equally important factor is the proper setup of conversions and their transmission into Google Ads. Without correctly configured analytics, you will not get a clear picture of how your campaigns are performing.
We paid special attention to Merchant Center and the product feed. We added new attributes, corrected the existing ones, and this delivered exactly what we expected in the end—a significant improvement in traffic quality.
Regular campaign optimization—including work with search queries, budget adjustments based on campaign performance, cleaning irrelevant placements in display campaigns, working with ad assets, and improving the ads themselves—is the key to effective advertising.
Anna Ponomaryova, PPC Specialist at marketing.link
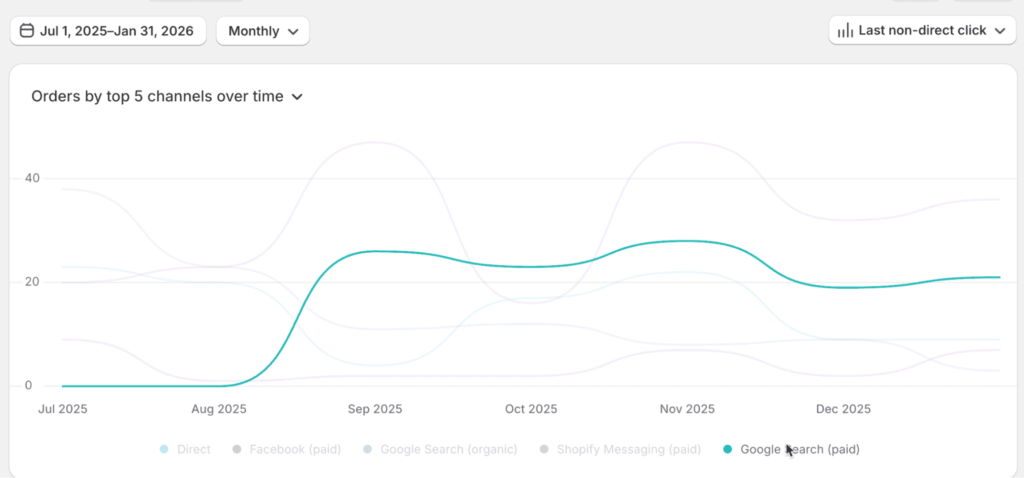
Google Ads Restructuring
After the SEO decline—Google Ads became the main sales channel. We rebuilt the account structure so every dollar worked only toward the strongest-performing segments.
We:
- kept only profitable regions;
- split standard shopping campaigns by product categories;
- paused weak-performing segments;
- scaled campaigns that consistently generated sales.
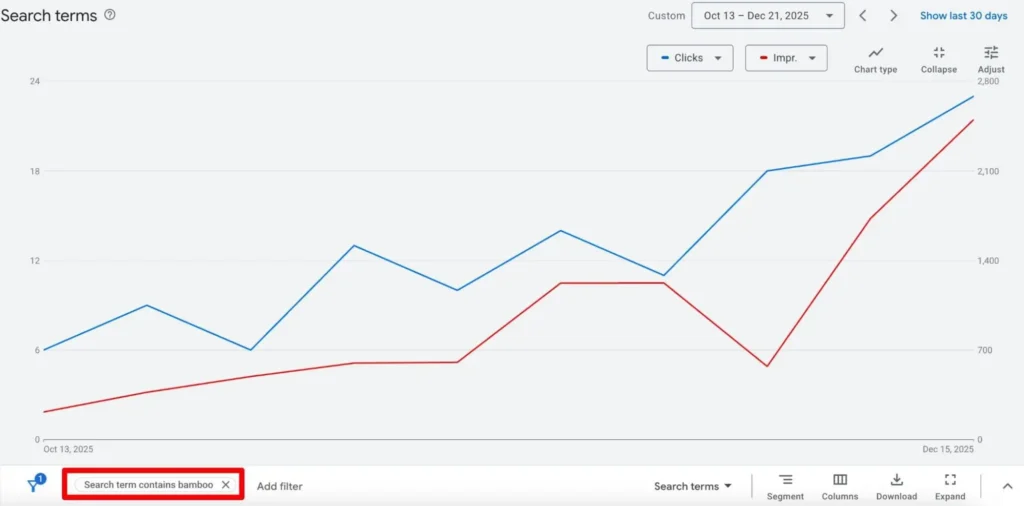
Custom Script for Cleaning Irrelevant Traffic
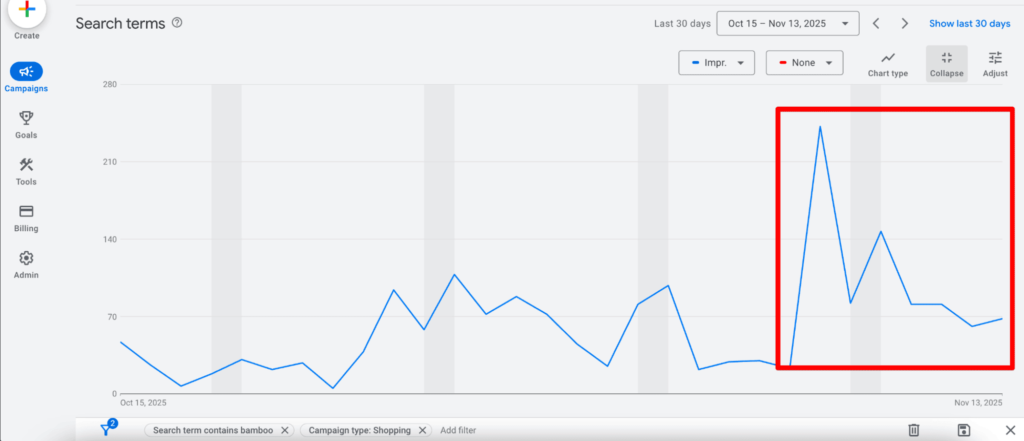
We created a separate Shopping campaign only for searches containing the word bamboo. We configured a custom script: if a search query did not contain the word bamboo, the system automatically added it as a negative keyword.
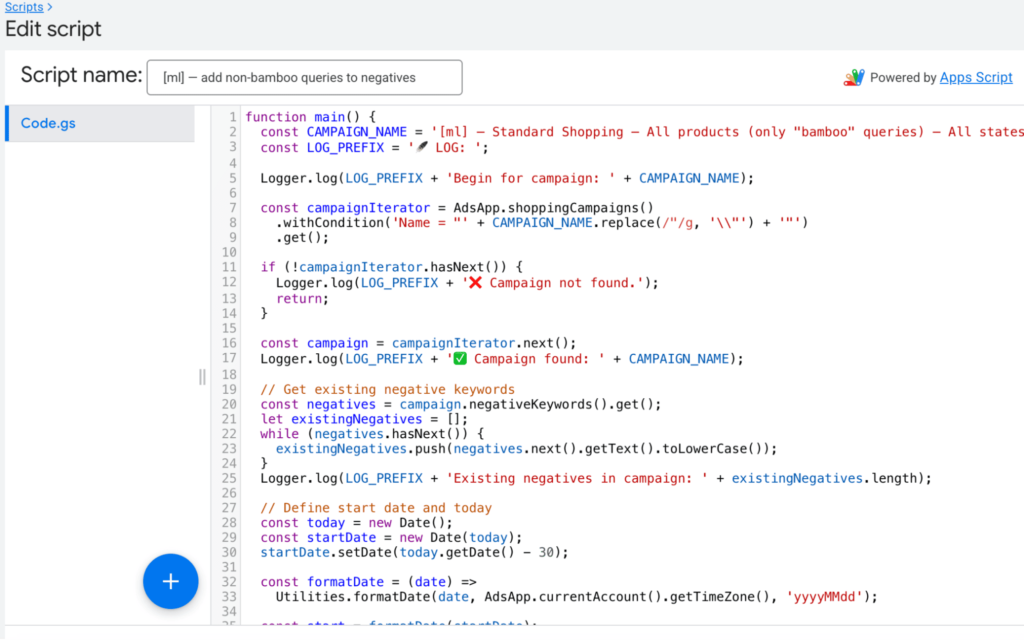
We intentionally narrowed the traffic to focus on the highest-converting search queries.
This resulted in three effects:
- the number of random clicks decreased;
- the quantity and quality of traffic increased;
- sales from Google Ads increased while other channels experienced a decline.
Demand Gen Campaign Launch
We strengthened remarketing and launched a Demand Gen campaign with a product feed. It worked only with warm audiences and brought users back to complete purchases.
Meta Ads Launch
We also recommended that the client launch Meta advertising. For a product that heavily depends on visual appeal, Meta performs extremely well—it not only captures existing demand but also creates new demand.

Expert Commentary
The client had two advertising accounts. One of them was blocked due to Meta policy violations after someone gained unauthorized access. Fortunately, the blocked account already had a strong conversion history through the Pixel.
To avoid losing this data and maintain stable performance, we transferred the Pixel from the old account to the new one. Additionally, in the Pixel settings, we restricted the domains that were used in the campaign launched after the account was compromised. This helped partially clean up the event history and prevented irrelevant traffic from being transferred to the new account.
Next, we created new custom audiences based on behavior—purchasers, users who added products to the cart but did not complete a purchase, and website visitors. This is a standard set of audiences, and a purchaser-based lookalike audience usually provides a strong starting point.
After that, we launched a Catalog Sales campaign for the entire product catalog. The campaign was divided into three ad sets—interests, behavioral signals, and a lookalike audience. For creatives, we immediately tested different formats—single image, collection, and carousel—to determine which would perform better.
We also launched a separate retargeting campaign for users who had already visited the website but did not make a purchase. This helps generate quick sales and allows the new account to “warm up” faster and build trust.
We also analyzed old campaigns from the blocked account and noticed that video ads consistently maintained a strong CTR and contributed a noticeable share of sales. Based on this, we decided to test this hypothesis and added a separate video campaign.
As a result, thanks to the fast Pixel transfer, data cleanup, and a well-structured launch of new campaigns with audience and creative testing, we were able not only to preserve valuable conversion history, but also to restore advertising performance in the new account. This approach helped minimize losses and restore sales within the first few weeks.
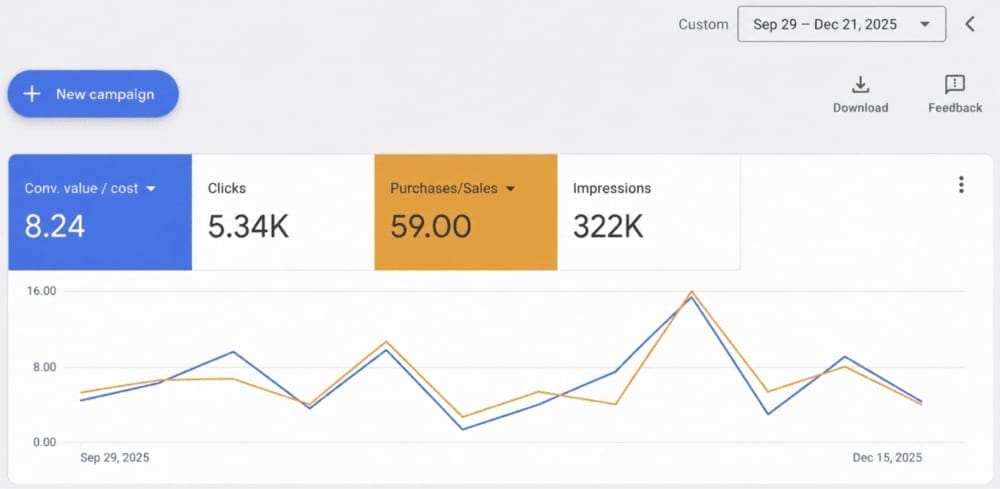
Results
Within just 3 months of working together, we increased Google Ads sales from 2 to 28 per month (+1300%), while the average ROAS grew from 14.4% to 824%. During the Black Friday period, it reached 1300%.
Conclusions
This case demonstrates a simple pattern. Strong results happen when advertising, analytics, the website, and the product feed work together as one system.
We gradually removed everything that was holding sales back and focused the budget on what was actually working.
That’s why Google Ads changed from a channel generating two sales per month into the main source of revenue for the business.
Order an individual consultation for your business
-
Tags