
8 MOST IMPORTANT REPORTS IN GOOGLE ANALYTICS 4 FOR AN E-COMMERCE PROJECT
Want to better understand user behavior on your website, discover certain insights, and increase sales, but Google Analytics 4 scares you with its complexity? In this article, I’ve compiled just 8 truly important and necessary reports in GA4 for an e-commerce project—enough to understand key numbers and make strategic decisions.
What’s it about?
Standard reports
Standard reports in Google Analytics show a clear picture—who came, what they viewed, and where they went. Multi-channel ones add drama: turns out a user might have changed their mind five times before buying. Let’s start with the standard ones.
Traffic acquisition report
The most important report for both e-commerce and any other type of website is the Traffic acquisition report. It’s located under Reports → Life cycle → Acquisition → Traffic acquisition. This report should be used to analyze the effectiveness of different traffic channels.

Let’s look at the main table and key terms.
Rows display Dimensions—various attributes/criteria that describe or characterize your data.
Columns contain Metrics—specific numerical values that reflect different aspects of your site’s performance based on the selected dimension.
For the most informative analysis, I recommend choosing the Session source/medium dimension and viewing stats based on it.
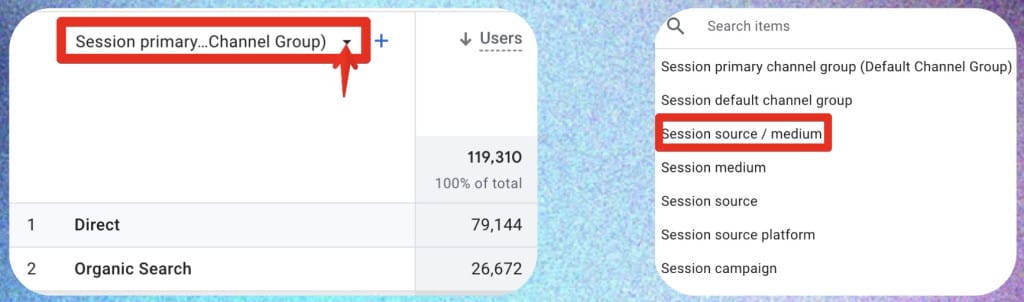

This report shows which traffic sources bring the most visitors, sales, and revenue. To correctly display the last two, enable e-commerce tracking on your site.
It will help you make informed decisions about budget allocation between various advertising channels.

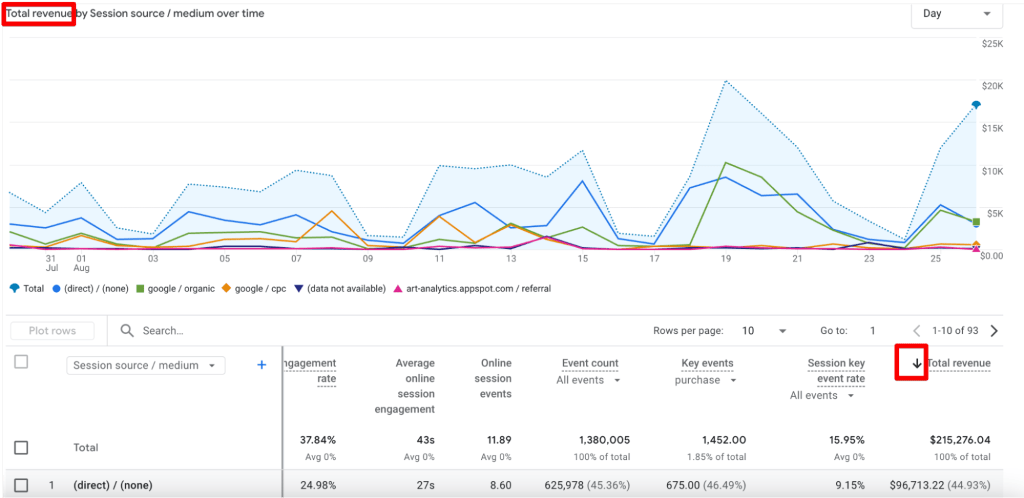
Each GA4 report also includes a line chart visualization at the top.
By default, the graph shows the number of sessions, but you can display any other metric. Just sort the table by the needed metric, and the chart will update automatically.
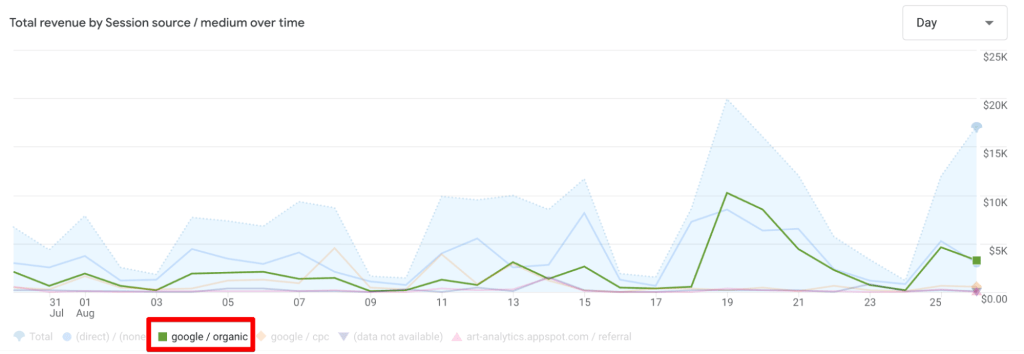
Click on a specific traffic source below the chart to highlight it visually for easier analysis.
Ecommerce purchases report
The next important report is the Ecommerce purchases report, located at Reports → Life cycle → Monetization → Ecommerce purchases.
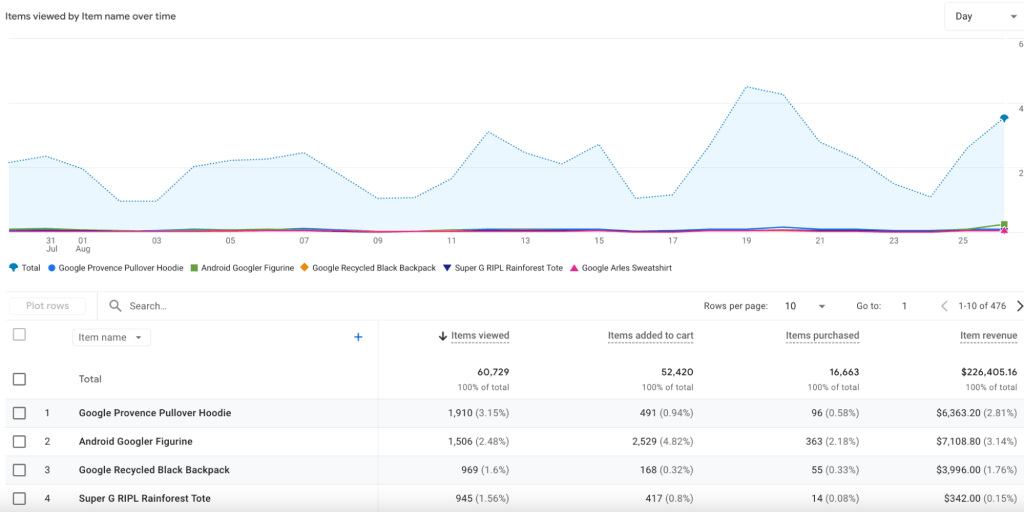
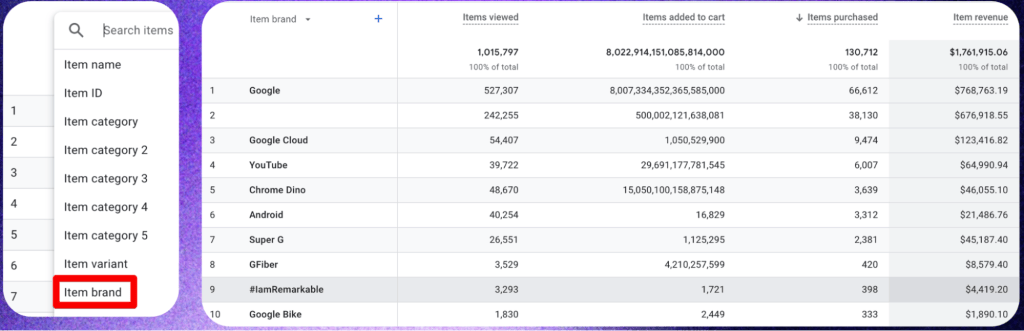
This report shows which products are most often viewed, added to cart, purchased, and which bring the highest revenue.
Based on this report, you can decide which products to scale ads for and which to exclude or reduce ad budgets for.
📌Read the article: How to track ecommerce purchases
In addition to data on each specific product, you can also analyze stats by categories or brands. Just select the appropriate dimension from the dropdown list.
Purchases journey report
The next report is the Purchases journey report, located next to the previous one: Reports → Life cycle → Monetization → Purchases journey.

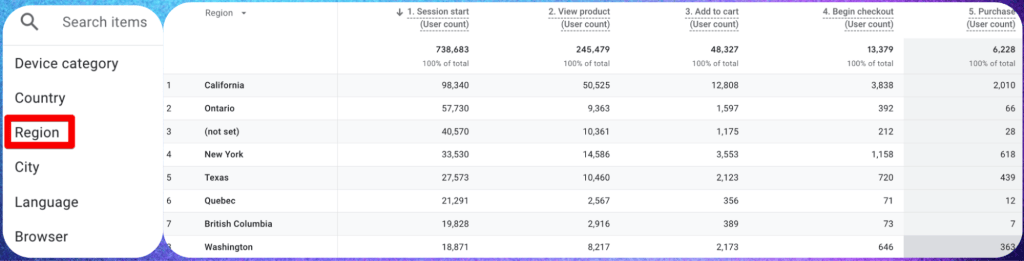
This report reveals the full path users take from the first site visit to the purchase through the cart and shows which steps in the checkout process need improvement.
For example, if you see a large number of users starting to check out but not finishing the purchase, it may indicate an inconvenient cart with too many required fields, a lack of convenient delivery methods, or technical issues (e.g., broken layout or non-working buttons).
As in other reports, you can change the dimension here. For instance, choose Region and analyze paths by users from different regions to see where drop-offs happen most often.
Demographic details report
To access this report, go to Reports → User → User attributes → Demographic details.

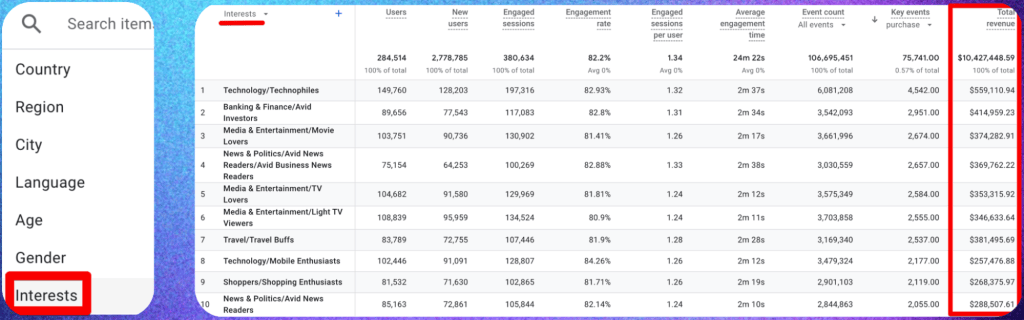
This report shows key socio-demographic characteristics of your traffic (age, gender, interests, region, etc.).
Why is this report useful? For example, by selecting the “Interests” dimension, you can see what your high-value users are interested in online — then use these interests in audience signals for Performance Max or social media targeting.
Tech report
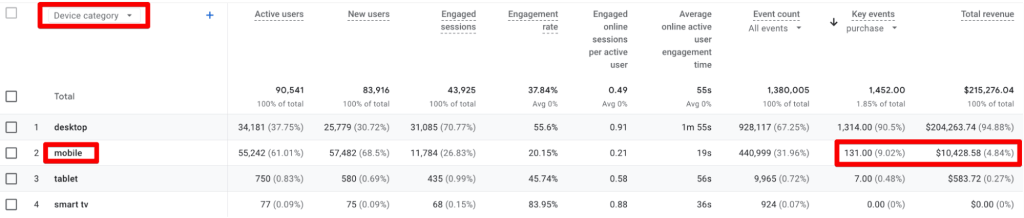
The Tech report, crucial for e-commerce, is found at Reports → User → Tech → Tech details.
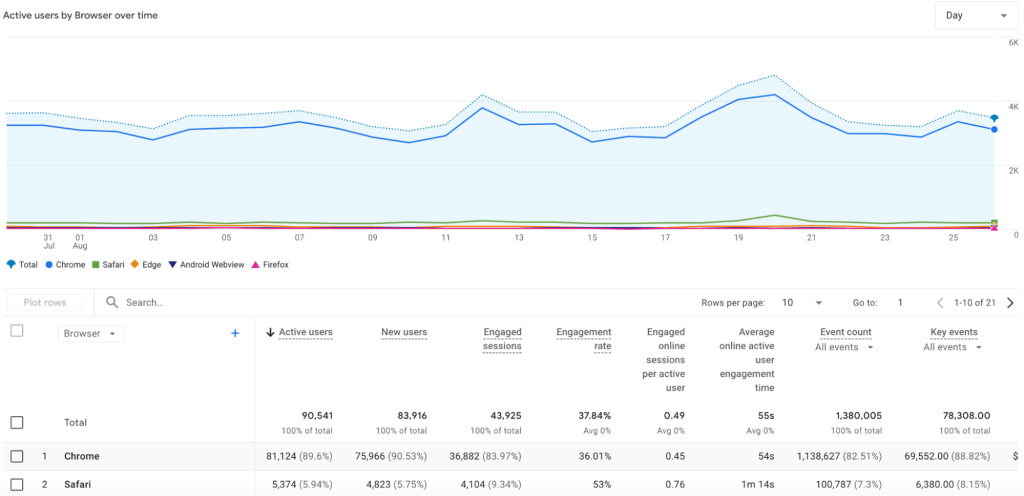
It provides detailed info on devices and technologies used by your visitors—such as device type/model, screen resolution, etc.—and helps identify compatibility issues with your site.
For instance, if you notice a low conversion rate on mobile devices, it may suggest poor mobile optimization.
Multi-channel reports
Multi-channel reports show the complex customer journey: the user didn’t buy immediately, but got lost between ads, emails, and socials before finally converting.
📌Read the article: What is data-driven marketing
Attribution paths report
This report is located under Advertising → Advertising → Attribution paths.
Attribution paths show the full journey a user takes across multiple marketing channels before making a purchase.
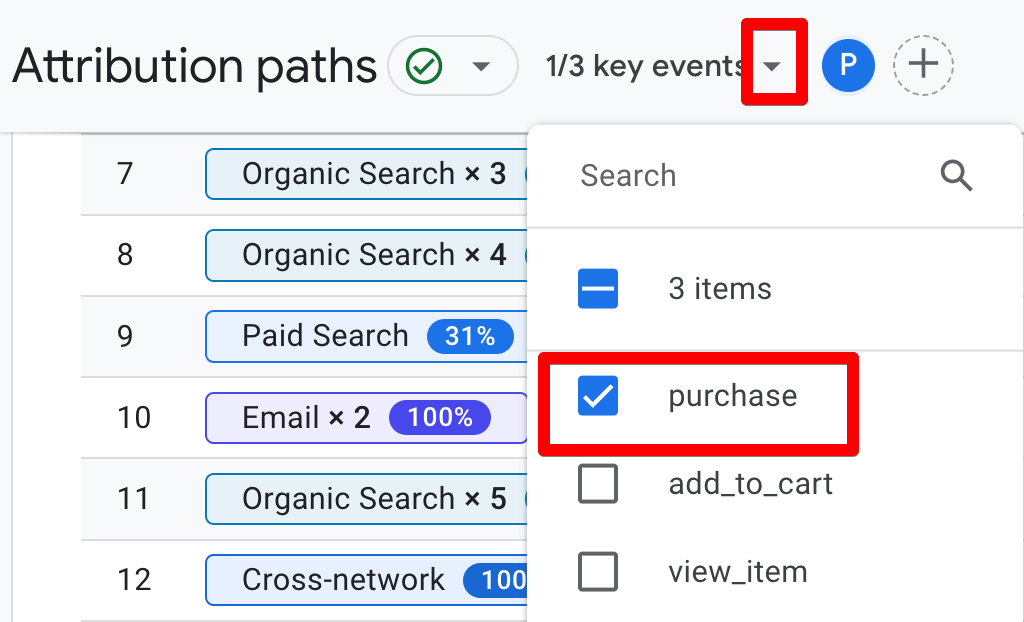

This report is especially useful in niches with long decision-making cycles—where sales don’t happen right away, and users go through many touchpoints. For example, someone might arrive via an email campaign, then organic search, then paid search, and only convert after a final organic visit.

It’s important to analyze these paths to understand how different marketing channels really contribute to sales.
This is particularly true for display campaigns, which are often undervalued in last-click attribution models used in standard reports. Display usually doesn’t close conversions directly, so it appears to contribute nothing.
But reviewing attribution paths may reveal that display campaigns play a crucial mid-funnel role. Turning them off could break the entire conversion chain and reduce sales.

All channels report
As a complement, also check out the All channels report under Advertising → Planning → All channels.
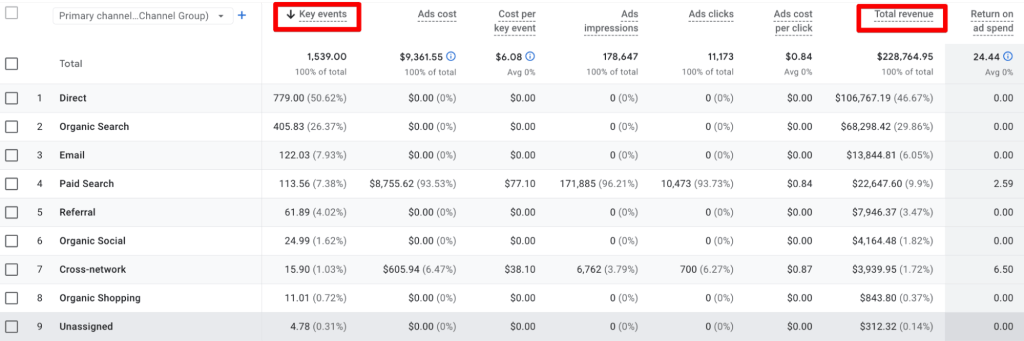
This report also uses data-driven attribution and shows the true cumulative contribution of each traffic source—regardless of where it appears in the conversion path.
Custom reports
Now let’s talk about custom reports in GA4, which adapt standard reports to your project’s needs.
There are 3 ways to create them:
Edit dimensions and metrics in a standard report


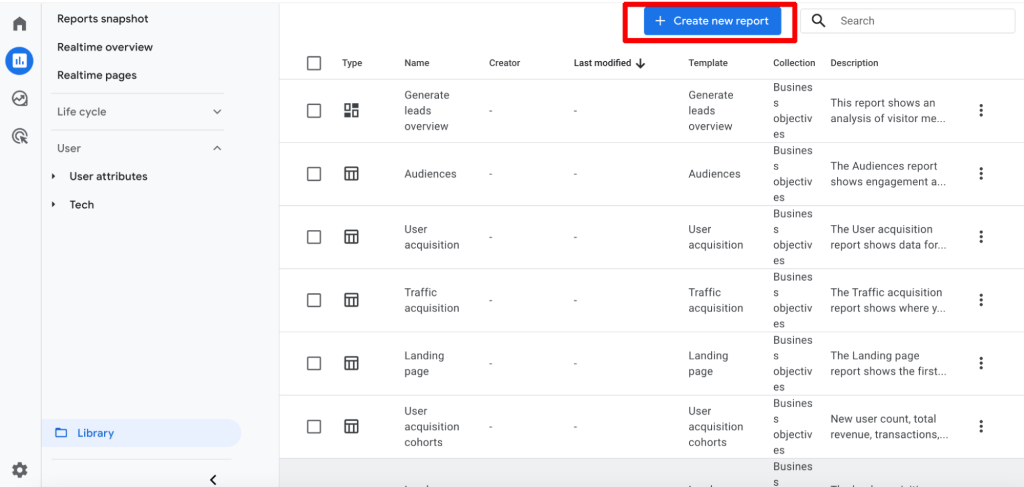
Create a new report from scratch via Reports → Library → Create new report
Use Explore, a powerful tool for deep, flexible data analysis
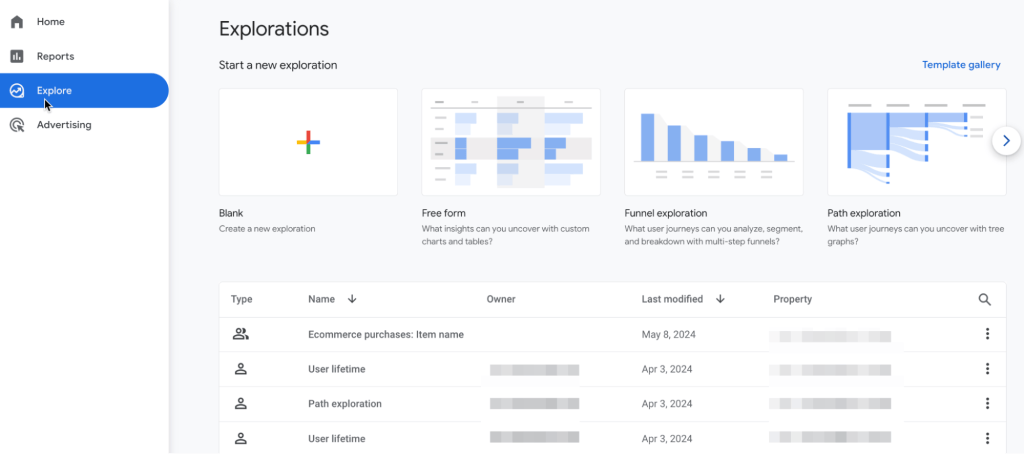
Explore lets you build any type of custom report, visualize data however you want, and analyze user behavior with various methods.
For example, using the User Lifetime method, you can see which traffic sources brought the users with the highest lifetime revenue—and focus more effort on them.

Conclusions
You don’t need to be a web analytics guru to spot business weaknesses and growth opportunities in digital. Check GA4 periodically, analyze, and use these 8 core reports to optimize ad budgets, improve site UX, and make informed decisions to increase e-commerce sales.
FAQ
The Traffic acquisition report is a basic and key tool for analyzing the effectiveness of traffic channels. It shows where users are coming from, how many of them made purchases, and how much revenue they generated.
Use the Session source/medium dimension for the most accurate analysis. In the table, pay attention to key metrics: number of sessions, conversions, and revenue. Also, select the desired metric to visualize on the chart.
This report displays product statistics—what is being viewed, added to the cart, purchased, and which products generate the most revenue. Analyzing this report helps optimize advertising spend on specific products.
